PAGES: [BACK to PROTEUS home page] Back to CKHS100 MAIN PAGE Outline Research protocol
SPECIAL TOPICS: Histograms/Central tendency Sensitivity/Specificity Rates Critical review
Evaluation Research Definitions Designs Sample size Sample methods Confounding
SAMPLE SIZE DETERMINATION and examples
[For power analysis nomogram click here]
NOTE (NEW!) I have added some EXTRA DETAILS for the calculation of the first (blue) practice sheet.
If you need to check how we arrived at a particular figure, please scroll down to the new section or click here
ALSO NEW ANSWERS TO third practice set of questions
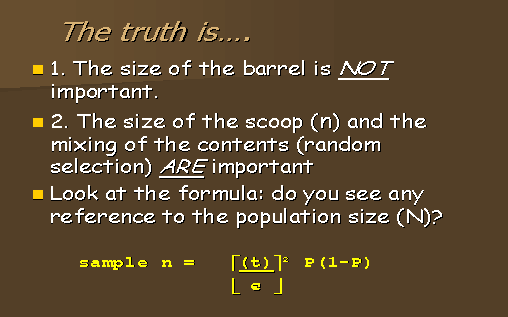
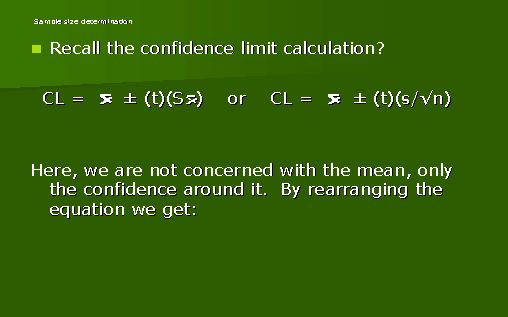
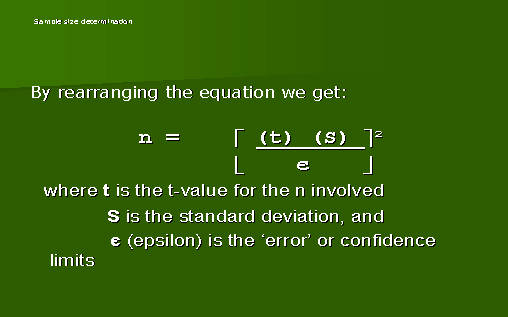
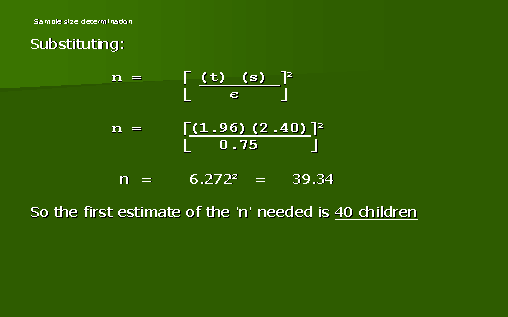
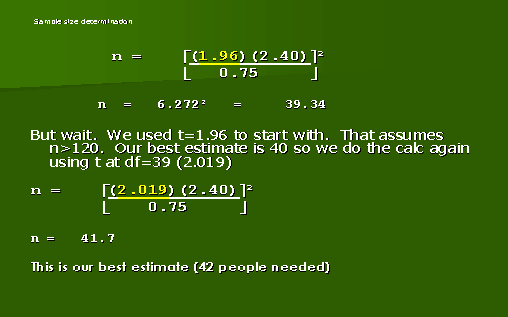
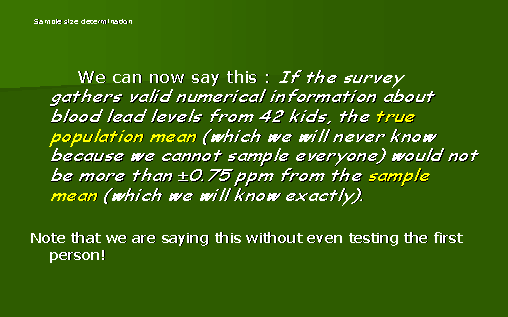
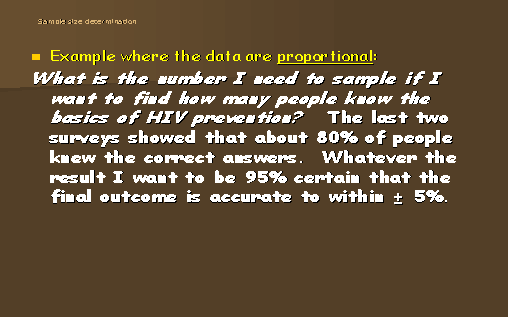
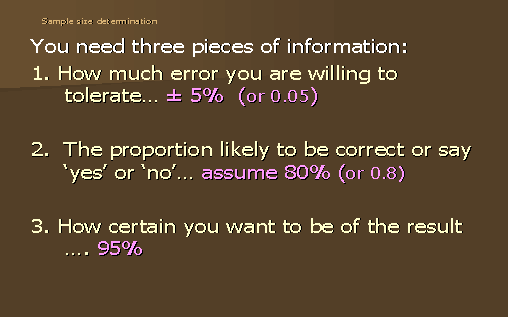
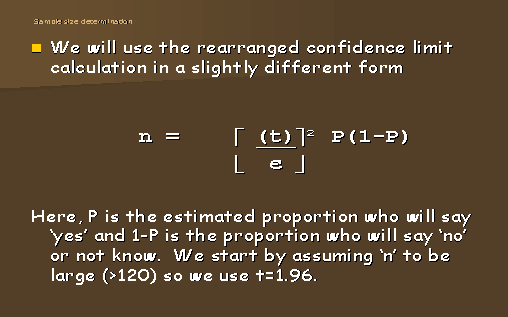
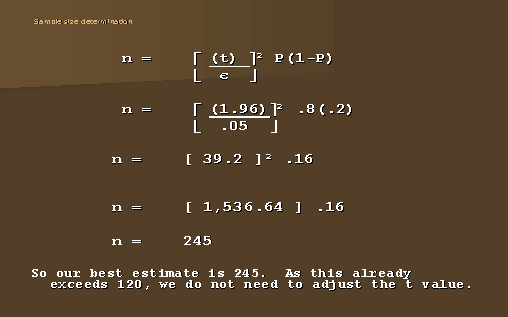
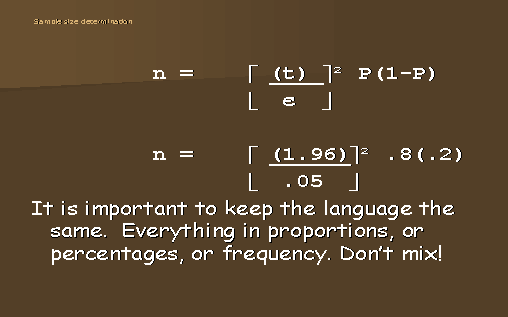
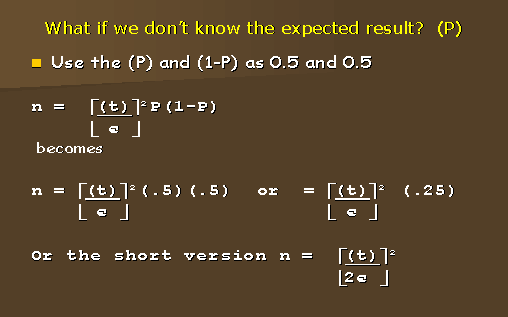
Hint: Re: finding the level of precision. Turn the above equation around so that the unknown (є) is on the left. Then substitute the terms on the right with the known values. so:
є becomes the SQ.ROOT of (1.96)² P(1-P)
n
Here is a worksheet using the methods we have just examined.
Something like this is very likely going to be part of the mid-term exam.
MID-TERM TEST PRACTICE SHEET #1
The following takes the form of a sequence of facts and decisions. Please answer the questions or provide the information in the correct sequence.
Here are some notes to assist you in the completion of the worksheet:
In A-D you are considering taking a single sample, but soon realize that with three groups present, if you want to be able to study each group, you cannot because of the small sample size for each group (especially groups A and B). So from (E) onwards you consider taking three separate samples, one for each population group. Up to (I) you are predicting the outcome with some uncertainty. in (J) and (K) you are able to see the real results and clean up the final statement.
| A) You intend to study the health-knowledge of 8,000 recent (<5yr) immigrants to a city. A single random sample would contain how many respondents (if you needed to be accurate to within +/- 5.5% 95% of the time) ? The questions are of the dichotomous type (right/wrong, yes/no, etc), and as you have no idea what proportion will have the correct answer, you need to use P = 0.5 (so 1-P is also 0.5) | (all) 317.5 =(318) | ||
| B) It becomes evident that almost all immigrants are Azerbaijanis, Balkans, and Catalans, and they are in the ratio 1:2:5. If you were to take a single random sample, (as in A) you should end up with the sample in the same ratio as in the population. How many would you have from each group?. | A 39.70 = (40) | B 79.37 =(80) | C198.43 =(199) |
|
C) What would the sample fraction be for each
group?
|
0.0397 | 0.0397 | 0.0397 |
| D) If you reported the results separately for each group, what would be the level of precision for each group? | +/- 15.97% | +/- 11.12% | +/- 6.93% |
| E) Now the precision is clearly too poor (too wide) to so you want +/- 5.5% precision for each group. How many would you need from each group? | 318 | 318 | 318 |
| F) What would the sample fraction be for each group now? | 0.318 | 0.159 | 0.064 |
| g) The budget will allow only 750 completed interviews for the whole study. At 250 per group, what would the sample fractions be now? | 0.250 | 0.125 | 0.050 |
| H) What would the level of precision be now? | +/- 0.062 | +/- 0.062 | +/- 0.062 |
| I) You expect a response rate to be 20% (people who complete the interviews. How many original attempts are needed to produce the final number that you need from each group? | 1250 | 1250 | 1250 |
| J) Assume the study is now complete. You have sent out the number of questionnaires shown in (I) above, and the response was 20%. But it turns out that 72% knew the correct answer. Calculate the precision again for this more detailed information | +/- 0.056 | ||
|
K) Now give the "72% were correct" statement showing
the confidence limit around the answer
|
72.0% CL95%: 66.43% - 77.57% |
||
Note also that for B the answer is rounded up to the next whole person, but the calculation for C uses an exact value.
....ADDED DETAILS - How we calculated these results:
|
A ) You intend to study the health-knowledge of 8,000 recent (<5yr) immigrants to a city. A single random sample would contain how many respondents (if you needed to be accurate to within +/- 5.5% 95% of the time) ? The questions are of the dichotomous type (right/wrong, yes/no, etc), and as you have no idea what proportion will have the correct answer, you need to use P = 0.5 (so 1-P is also 0.5) |
(all) 31 7.5 or 318 |
||
|
B) It becomes evident that almost all immigrants are Azerbaijanis, Balkans, and Catalans, and they are in the ratio 1:2:5. If you were to take a single random sample, (as in A) you should end up with the sample in the same ratio as in the population. How many would you have from each group?. |
A 39.70= (40) |
B 79.37 =(80) |
C 198.43 =(199)
|
For (B) We are told that the ratio of A:B:C is 1:2:5 This is solved by counting the 'total' number of 'units' or 'shares'. 1+2+5 = 8 so A has 1/8, B has 2/8 and C has 5/8 (Altogether 8/8) You have calculated a single sample 'n' as 318, so multiply 318 by 1/8 to obtain A's 'share', 2/8 to obtain B's share, and 5/8 to obtain C's share.
|
C) What would the sample fraction be for each group? |
0.0397 |
0.0397 |
0.0397 |
For (C) The sample fraction is n (sample) divided by N (population), and in this case it is the n/N for EACH of the three groups. You have the numerators (n) for each, and need the denominators. We are told the WHOLE population is 8
,000 people, so divide 8,000 into the 1:2:5 ratio as in the last question. In this way (because I have used VERY simple figures) you get *(for A:) 40/1,000, for B: 80/2,000 and C: 200/5,000. They all turn out to be the same of course.|
D) ) If you reported the results separately for each group, what would be the level of precision for each group? |
15.5% |
For (D) Here you need to turn the equation around as shown in the slides. You are looking for the precision (e ), so this comes out to the left side = everything else on the right side.
Starting with n = [1.96]2 P(P-1)
[ e ]2
|
For A: e = |
√ |
1.962 P(1-P)n |
|
e = |
√ |
1.962 (0.25)40 |
|
e = |
√ |
0.024 = 0.155 or (± ) 15.5% |
Similarly calculated for the other two groups
|
E ) Now the precision is clearly too poor (too wide) to so you want +/- 5.5% precision for each group. How many would you need from each group? |
318 |
318 |
318 |
Here, you are not satisfied with the sometimes WIDE precision in the last calculation, and insist that the
precision term (e ) is 5.5%, or 0.055. SO you need to calculate the new "n" using e as 0.055:
BUT THIS IS THE SAME as question (A).. EACH of the three groups woild need n=318
|
F) What would the sample fraction be for each group now? |
0.318 |
0.159 |
0.064 |
You have the new numerators (318), and the original denominators......
|
G) The budget will allow only 750 completed interviews for the whole study. At 250 per group, what would the sample fractions be now? |
0.250 |
0.125 |
0.050 |
Now you are restricted to total 750 (250 each), so calculate the new sample fractions
|
H) What would the level of precision be now? |
0.062 |
0.062 |
0.062 |
... again work with this
|
For A e = |
√ |
1.962 (0.25) = 0.062 (for each one)250 |
|||
|
I) You expect a response rate to be 20% (people who complete the interviews. How many original attempts are needed to produce the final number that you need from each group? |
1250 |
1250 |
1250 |
||
(If only 1 in 5 respond, you need five times 250 to get 250 completed responses)
|
J) Assume the study is now complete. You have sent out the number of questionnaires shown in (I) above, and the response was 20%. But it turns out that 72% knew the correct answer. Calculate the precision again for this more detailed information |
+/- 0.056 |
(J) Here, the response rate WAS 20%, but now we have the results and 72% knew the correct response, whereas we had taken 50% (0.5) for the calculations.
Re calculate the precision using P=0.72 (and 1-P=0.28)
|
e = |
√ |
1.962 (0.72)(0.28) = 0.0556250 |
|
|
K ) Now give the "72% were correct" statement showing the confidence limit around the answer
|
"The survey showed that 72.0 percent of the sample were able to answer correctly, with 95% confidence limits : 66.43% to 77.57% |
||
(K) This could be described in greater detail as follows: While the sample showed 72% correct, we can be 95% certain that the larger population from which the sample was taken would have responded correctly between 66.4% and 77.6%.
In reality, you should make this final statement separately for EACH of the 3 groups
.
MID-TERM TEST PRACTICE SHEET #2
Try this sheet yourself.
|
A) You intend to study the responses to a food-borne disease quiz among 10,000 food handlers. A single random sample would contain how many respondents (if you needed to be accurate to within +/- 4 percent, 95% of the time) ? The questions are of the dichotomous type (right/wrong, yes/no, etc), and as you have no idea what proportion will have the correct answer, assume that 50% will respond correctly |
600.25 (=601 people) | ||
|
B) It is reasonable to assume that those who have had some technical education are better prepared, but there are only 5% of the workers (type W) who have had the full week course and another 15% who have had the one day course (type D). The rest (80%) are untrained (type U). If you were to take a single random sample, (the "n" as in A) you should end up with the sample in the same ratio as in the population. How many would you have from each group?. |
W:30 | D:90 | U:480 |
|
C) What would the sample fraction be for each
group?
|
30/500 =0.06 |
90/1500 =0.06 |
480/8000 =0.06 |
| D) If you reported the results separately for each group, what would be the level of precision for each group? |
(using t=2.04, df=30) + 0.1862 |
(using t=1.97, df=90) + 0.1038 |
(using t=1.96, df=480) + 0.0447 |
|
E) Now the precision is clearly too poor (too wide) to so you want +/- 5.5% precision for each group. How many would you need from each group? |
318 | 318 | 318 |
| F) What would the sample fraction be for each group now? |
318/500 = 0.636 |
318/1500 = 0.212 |
318/8000 = 0.040 |
|
g) The budget will allow only 720 completed interviews for the whole study. If you assume equal n for each sub group, what would the sample fractions be now? |
240/500 = 0.480 |
240/1500 = 0.160 |
240/8000 = 0.030 |
| H) What would the level of precision be now? | + 0.063 | + 0.063 | + 0.063 |
|
I)
You expect a response rate to be 24% (people who complete the interviews.
How many original attempts are needed to produce the final number that you need from each group? |
240/0.24 = 1000 |
1000 | 1000 |
|
J) Assume the study is now complete. You sent out the number of questionnaires shown in (I) above. But it turns out that only 22% responded, but that 78% knew the correct answer. Calculate the precision again, using this more detailed information |
+ 0.0547 | ||
|
K) Now give the "78% were correct" statement showing
the confidence limit around the answer
|
The proportion answering "yes" was 78 %...with 95 % conf limits between 72.53 % and 83.47 % | ||
Note that where appropriate, the calculation was repeated with an adjusted t value corresponding to the best estimate of n.
MID-TERM TEST PRACTICE SHEET #3
SOLUTION..........
1. 384
2. 43 (4y) and 341 (2y)
3. sample fractions 0.028 for both
4. precision (uncorrected for t value): 0.150 0.053
(corrected for t value): 0.154 0.053
5. (stratify) number needed for each group to be ±0.05 precise at 95% confidence: 384 for both
6. sample fraction now: 0.256, 0.032
7. precision: 0.05, 0.05
8. Number to be contacted with response rate of 20%: 1,920 (each group)
9. (Results) 0.23 and 0.21
10. final precision: 0.0383, 0.0481
11. Four-yr graduates on average passed at rate of 79 percent, (95% conf. limits: 75.2%, 82.8%)
12. Two-yr graduates on average passed at rate of 58 percent, (95% conf. limits: 53.2%, 62.8%)