PAGES: [BACK to PROTEUS home page] Back to CKHS100 MAIN PAGE Outline Research protocol
SPECIAL TOPICS: Histograms/Central tendency Sensitivity/Specificity Rates Critical review
Evaluation Research Definitions Designs Sample size Sample methods Confounding
The following is a series of "second-looks" at claims, conclusions, advertisements, and results that should not have been believed in the first place.


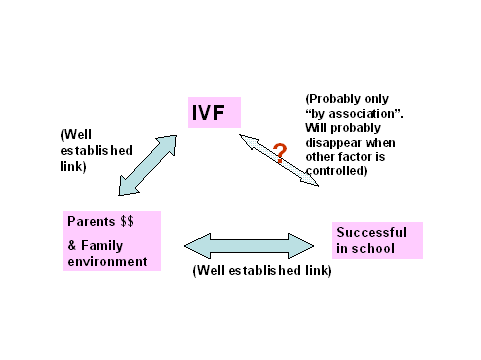
MISSING INFORMATION!
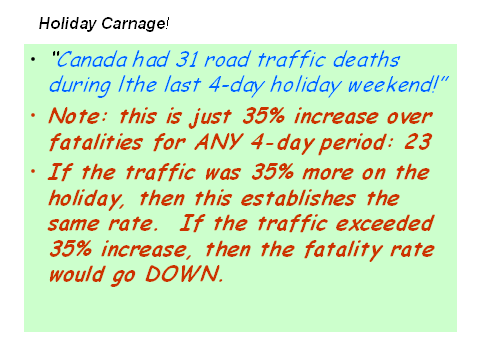
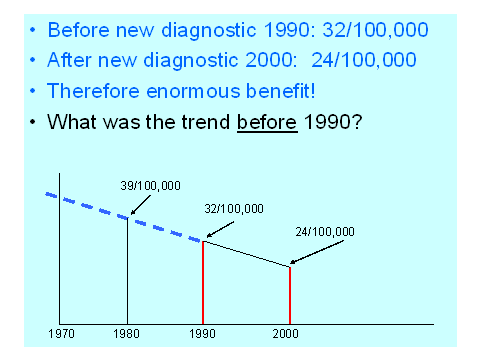
MISLEADING PEOPLE THROUGH RELYING ON ONLY TWO DATA POINTS.
Must ask- what was happening before??.......
This is an example of a well-known (but still fascinating)
illusion. Do the math yourself !...........
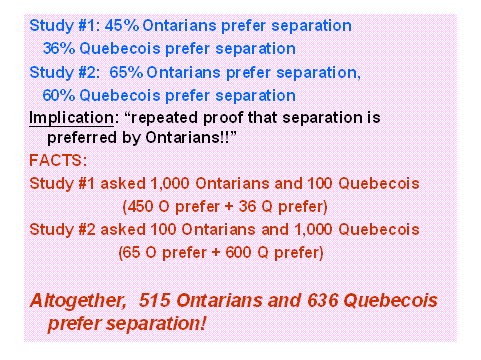
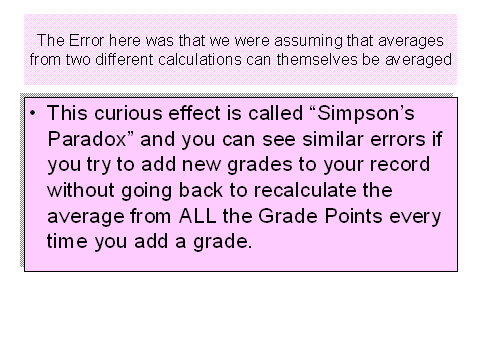
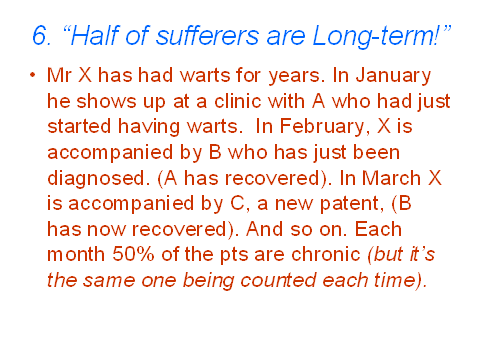
......GUILTY OF REPEATED-COUNTING OF SOME BUT NOT OTHER PARTICIPANTS.
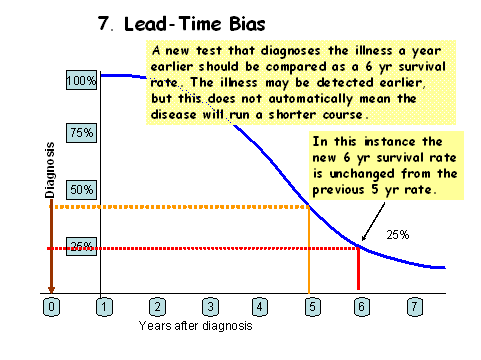
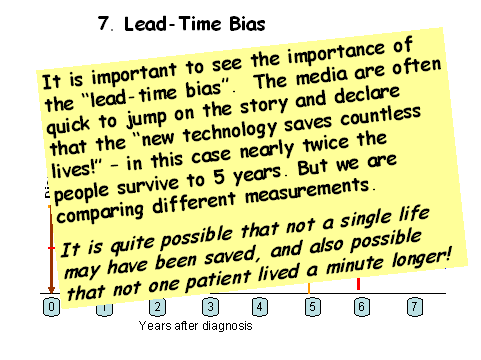
The next example comes from the Ontario Government Lottery Corporation several weeks after the "39" lottery began. This pamphlet was designed to encourage people to purchase tickets and gamble on the odds. Read the text carefully...
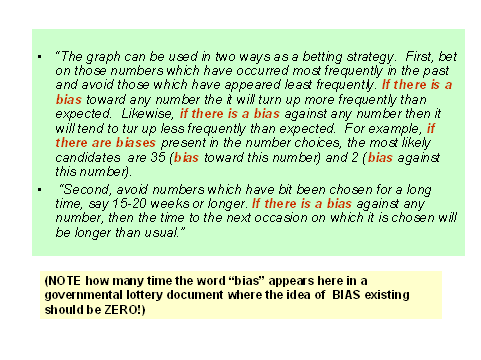
This is what the public saw on the pamphlet...
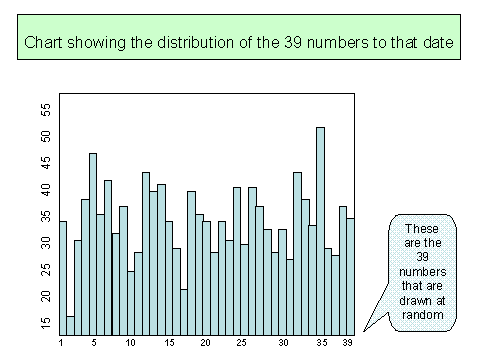
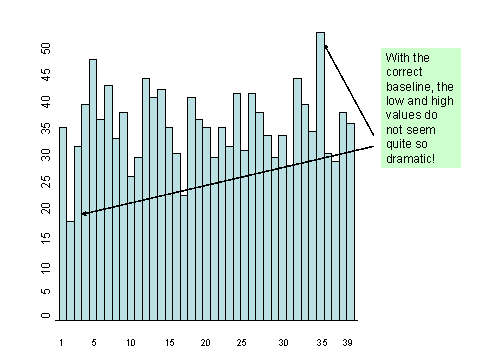
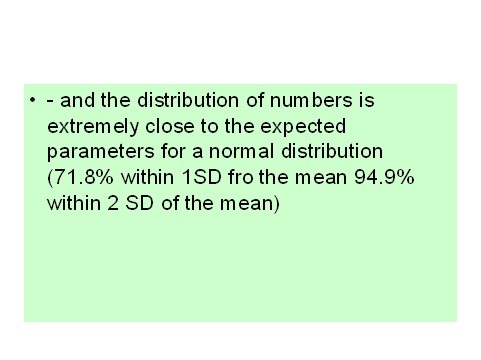
This is how the data should have appeared if the chart were drawn properly
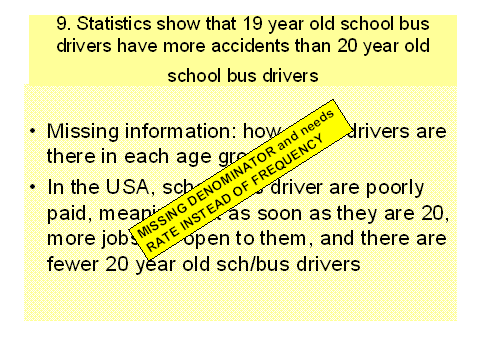

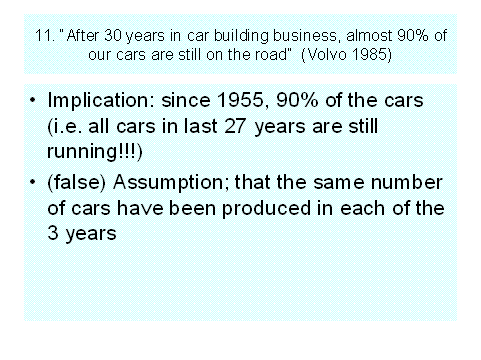

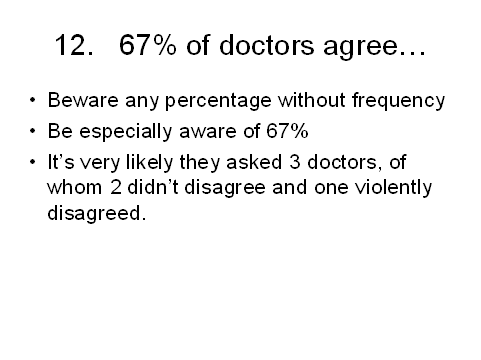
This was ANOTHER EXAMPLE OF THE MISSING DENOMINATOR!!!!
The rule is, whenever you use a frequency (count) add a percentage.
(Whenever you use a percentage, provide the original frequency as well)
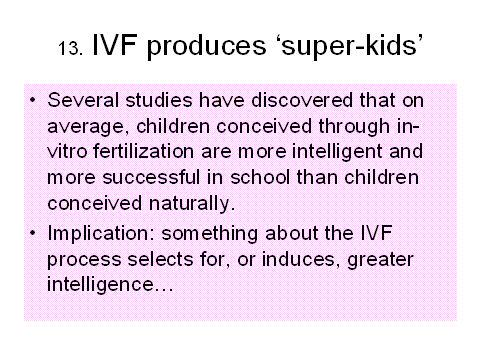
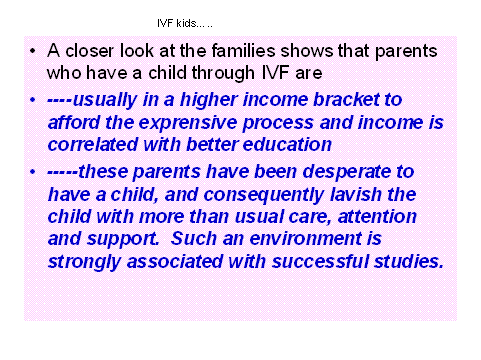
This is also an excellent example of a confounder
