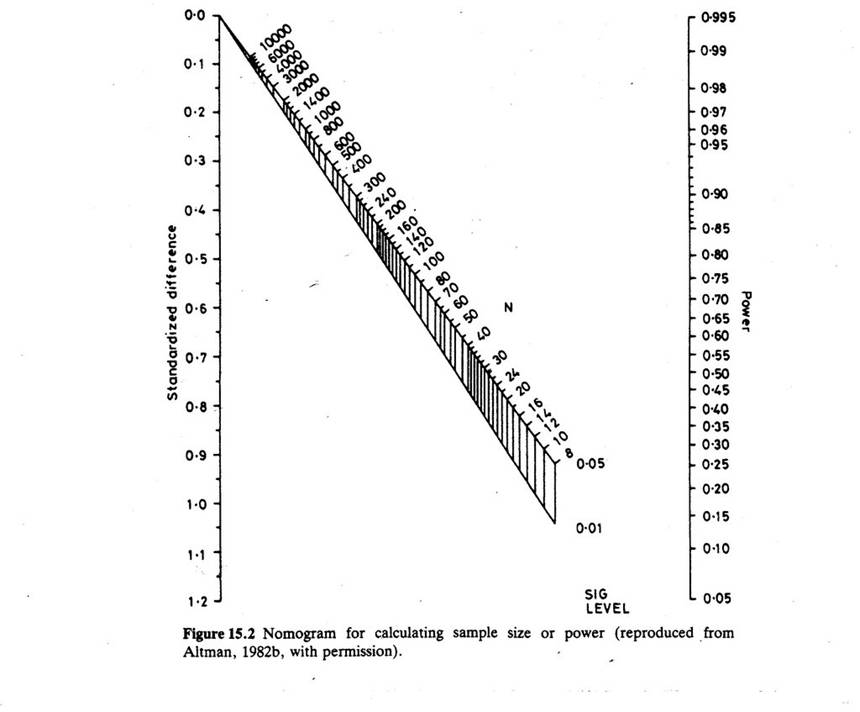
NOMOGRAM FOR POWER ANALYSIS: notes on how to use....................
Using the nomogram for sample size calculations
(a) continuous data, two independent groups. For example: Suppose that prior to launching a feeding supplement
program among children in a malnourished area, we are designing a trial among laboratory rats of the supplement
to see if an increase in body mass is achievable. Rats are to be randomly assigned into two groups: a protein-poor
diet (estimated to be equivalent to children's diet in the test region, and a diet with the enhanced protein content.
We know that rats from 2 weeks to 12 weeks should increase by 280 g with a standard deviation of 35 g.
We anticipate that the supplement will increase weight gain by additional 20 g by week 12. We want a high probability
of detecting this increase so we set the power to 90% and a 5% significance level.
METHOD: We need: Standard deviation of the variable (S)
Clinically relevant difference or effect (δ)
Significance level (α)
Power: This is the chance of finding the effect if it exists. It is written as:
1 minus the risk of NOT- finding the effect if it did exist (1- β) where
the symbol on the right is a "beta" (in case it does not show on your browser)
"Standardized difference" is Clinically-relevant difference or effect (δ) = 20 = 0.57
Standard deviation (S) 35
Use the nomogram with StdDiff at 0.57, power at 90% (0.90), and rejection level (α) at 0.05 to obtain n = 130 or 65 in each group.
(b) categorical data (binary: two groups) For example: A new electrical stimulation device for epileptics is being tested.
Patients are able to give themselves a mild, regulated electrical stimulus immediately they feel a seizure might be imminent.
Twenty percent (20%) of these patients could expect to be free of seizures in a 12 month period. The device would be
considered a success if that rate could be doubled to 40% seizure-free in a year, and we want a 85% probability of finding
this result if it exists (at 99% significance).
METHOD: Need: The expected proportion with the outcome in each group (p1 and p2)
Significance level (α)
Power (α)
The Mean between the 'existing' and the 'target' output (p1+p2)/2 is denoted '
![]() '.
'.
(Please note on some browsers this may not appear correctly. It is described as "p-hat" and resembles a small p with
a circumflex accent on top.)
"Standardized difference" is _ p1 - p2 = 0.4 - 0.2 = 0.2 = __0.2_ = 0.44
√![]() (1-
(1-![]() )
√0.3(0.7)
√0.21
0.458
)
√0.3(0.7)
√0.21
0.458
(where
![]() is
the mean of p1 and p2)
is
the mean of p1 and p2)
Use the nomogram with StdDiff: 0.44, power: 85% (0.85), and α as 0.01 to obtain n = 260 or 130 in each group.