|
BACK TO
PROTEUS HOME PAGE
440 -
OUTLINE 440- DEFINITIONS <=you are here 440 - TESTS AND EXAM440 - PROBLEMS AND SOLUTIONS 440 - CALCULATOR HELP |
DEFINITIONS
Material on this page should be consulted along with its use in the examples.
|
BIAS: see Systematic Error
|
|
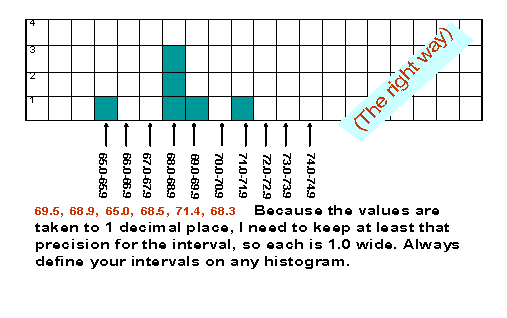
HISTOGRAMS
|
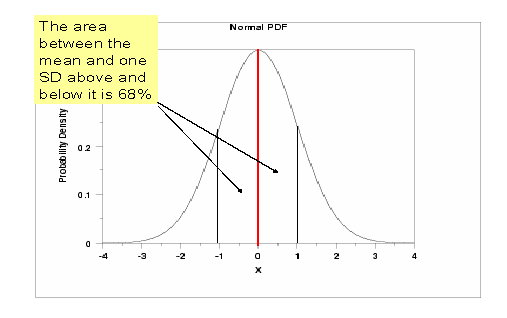
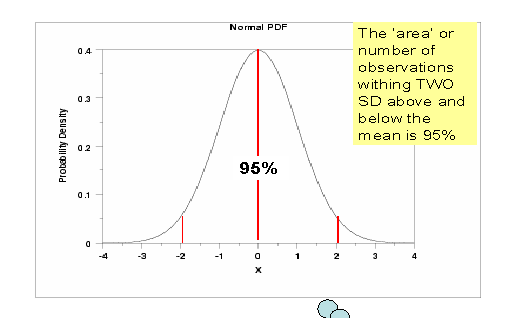
| NORMAL DISTRIBUTION: The familiar, symmetrical, bell-shaped distribution of data that has 68% of observations within ±1 SD around the mean, 95% of observations within ±1.96 SD around the mean, 99% of observations within ±2.57 SD around the mean, etc. |
| RANDOM ERROR: Due to normal biologic variation between individuals. cannot be removed or reduced. Can only be recognized and taken into consideration in analysis. In a truly random sample, the only sampling error should be random error, NOT systematic error. |
| SAMPLING ERROR: The variation between the target population and the sample taken from it. May be due to either random error which is due to normal variation and cannot be avoided, or systematic error, which will render the research worthless. |
|
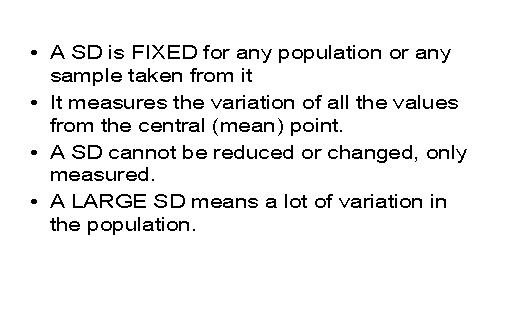
STANDARD DEVIATION:
Measures the "tightness" of the data clustered around the mean in a 'normal'
distribution. It does NOT vary for a given population or any sample
taken at random from it.
(SOME ADDITIONAL DIAGRAMS)......
To be more precise, it is not TWO SD but 1.96 SD. Ninety five percent of the observations will occur within the area bounded by (mean-1.96SD) and (mean+1.96SD)
|
|
STANDARD ERROR OF THE DIFFERENCE BETWEEN TWO
MEANS: Measures the variability of the difference between two means being compared in a t-test for unpaired data. It is written as S0-0 and usually calculated as the "pooled variance" of the two samples: /(s1²/n1 + s2²/n2) It forms the denominator of the t-statistic in a t-test for unpaired data and it is important to realize this reduces in size as the numbers (n) in the two samples increases. |
|
STANDARD
ERROR OF THE MEAN: Measures the
variability that can be expected around the mean of a single sample and is a
function of both the standard deviation and the number in the sample. Written as SEM or SE0 or S0 and calculated as /s²/n or s//n It is important to realize this reduces in size as the number (n) in the sample increases. |
|
STANDARD
ERROR OF THE MEAN DIFFERENCE:
Measures the variability of the mean difference in a t-test for paired data. Written as SEđ and calculated as /(Sd²/n) or Sd//n It forms the denominator of the t-statistic in a t-test for paired data and it is important to realize this reduces in size as the number (n) of paired differences in the sample increases. |
| SYSTEMATIC ERROR: This is also known as "Bias". It is any type of sampling error that is due to a specific non-representational sampling method in which the sample does not represent the target population. It must be avoided at all costs. |
| TARGET POPULATION: The population about which you wish to understand something. The size of the TP is inaccessible to your research resources for measuring or observing in its entirety. So we take a random sample from the TP, to study the parameters in detail, and than make a cautious inference about the TP from what we learned from the sample. |
|
VARIABLES: 1. Variables VARY. They are characteristics that you need to observe, record, or measure, such as weight, height, blood lead level, score on a test, or GPA. 2. They can be continuous var (measurements on a sliding scale), or categorical ('bins' or groups that whole units are placed in) such as well/ill, exposed/not exposed, male/female, dead/alive, pre/post, etc. 3. Independent ('input') variables occur before the outcome variables, and MAY influence the outcome var. Demograophic var are always independent 4. Dependent var (outcome) variables occur AFTER input var (chronologically) and may be influenced by them. Example1 : Study of the effects of hours spent reviewing ENH440 notes on the final tern result: INPUT (indep.) V: hours spent reviewing (continuous), OUTCOME (dep) V: final exam % score (continuous) Example 2: Study of the effects of not wearing hearing protection upon hearing damage among riveters. Input (indep) v: wearing or not wearing protection (categorical); Outcome (dep) v: audiometry score % hearing loss (continuous) Example 3: Study of the effects of eating egg salad sandwiches on risk of illness. Input (Indep) v: eat or not eat sandwiches (categorical); outcome (dep) v: ill/well (categorical) Can a variable be BOTH input and outcome? Yes though in separate analyses. For instance, in a question "Does education about HIV transmission change the knowledge of the learners about safe sex?", the Ind.var is "education", and the Dep.var is "knowledge". But in a later analysis in the same study, you may wish to explore the question: "do those who know about transmission of HIV actually tend to practice safe sex?" In this case the "knowledge" is the indep var, and the practice is the dep.var. Can you see how the "knowledge" var changed its role here?
|


