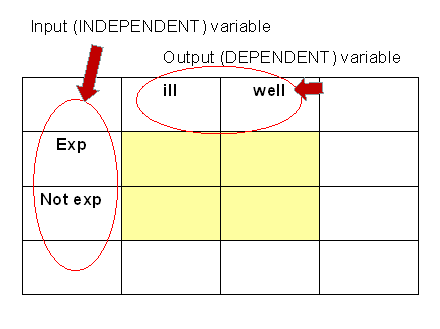
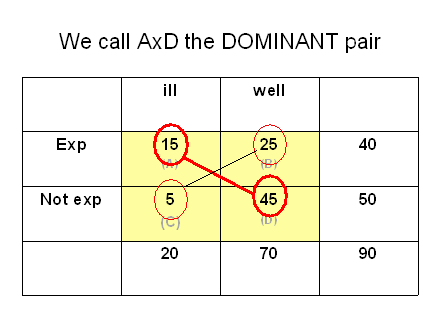
First look at the DIRECTION.......
Cross-multiply AxD / BxC...
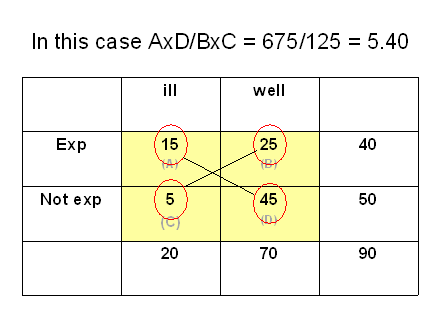
THIS IS CALLED THE "ODDS RATIO"
ODDS RATIO of 5.40 is NOT 1.0, so we HAVE A RELATIONSHIP (ASSOCIATION) BETWEEN EXPOSURE AND ILLNESS! (1.0 means NO RELATIONSHIP)
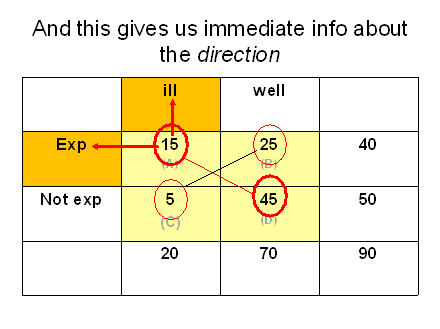
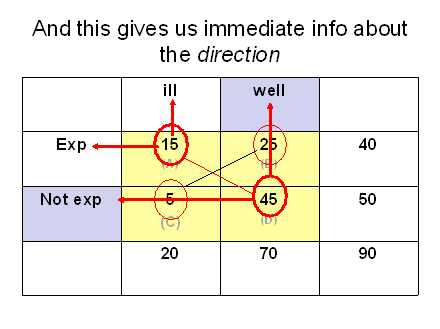
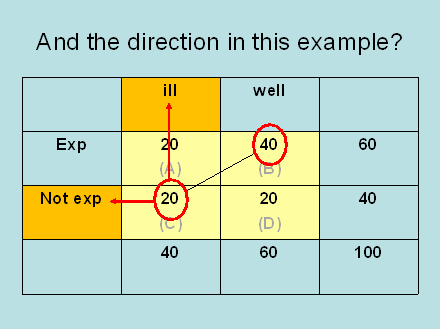
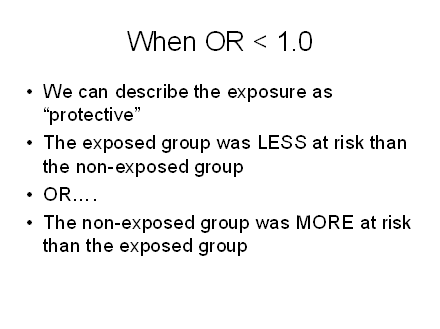
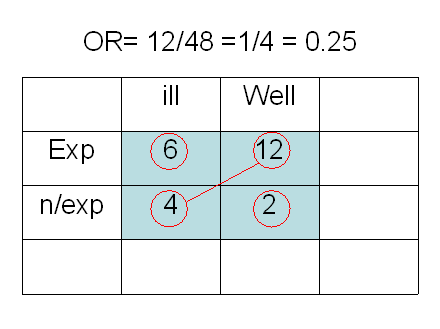
So... the EXP group was 0.25 times as likely to be ill as the Non-EXP group... OR if you prefer ... The Non-EXP group was 4 times as likely to be ill as the EXP group
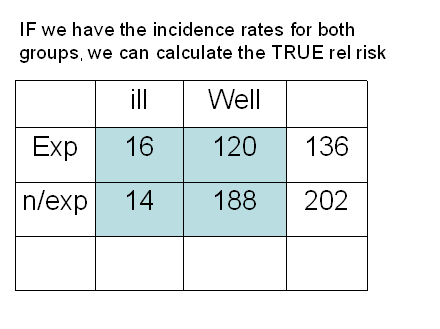
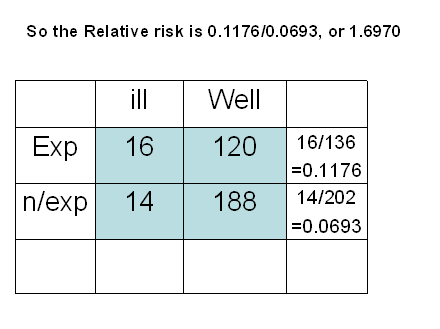
INCIDENCE RATES are the (number of cases of illness)
(Total # of people)
Here we have Incidence rates for the EXP group and also for the Non-EXP group
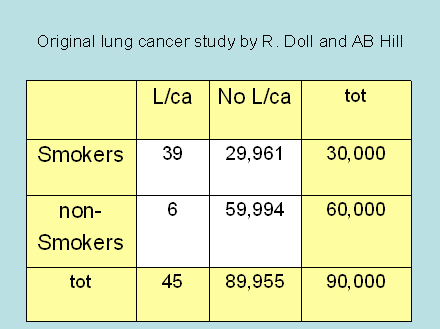
The outcome indicates the deaths from lung cancer
PER YEAR for each exposure group. If we place the
new deaths for lung cancer for one year over the
group population, we have the true incidence rates
for both groups
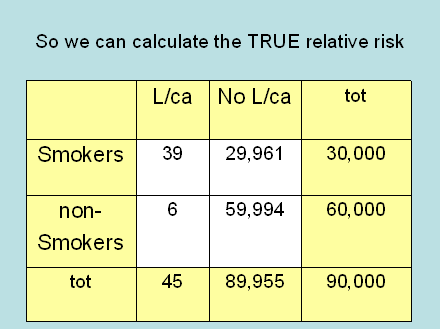
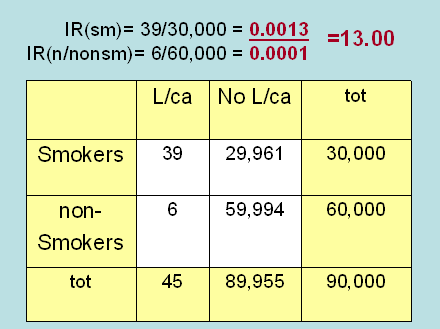
The interpretation is similar to the interpretation for the odds ratio.
In this study, we can observe a 13 times increased risk for developing
lung cancer among smokers compared to non-smokers. This additional
risk of lung cancer due to smoking has now been observed in more than
60 fully-accredited studies. All studies
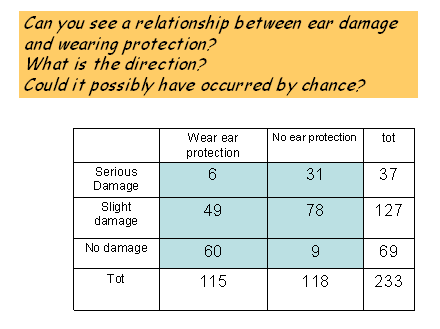
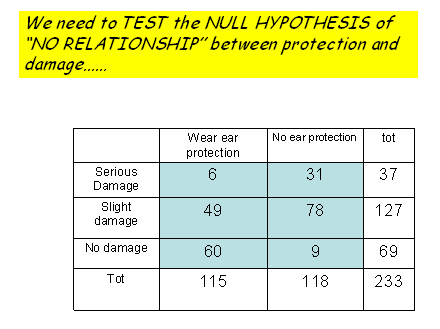
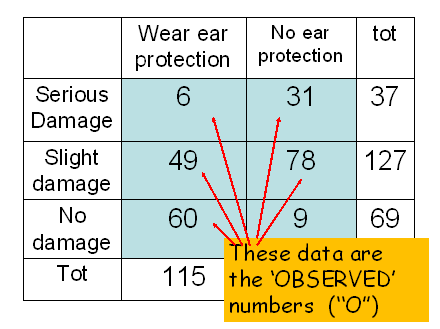
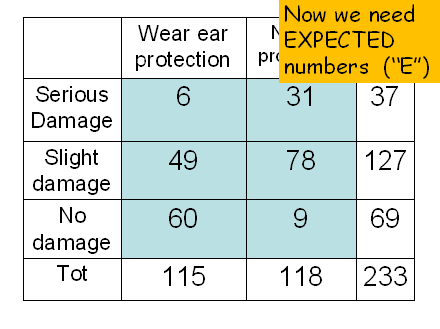
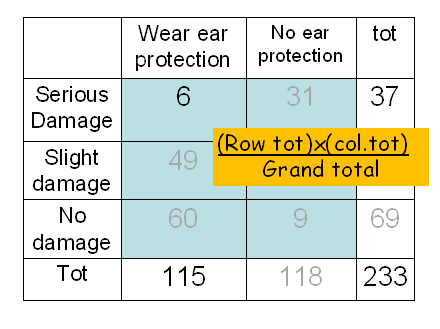
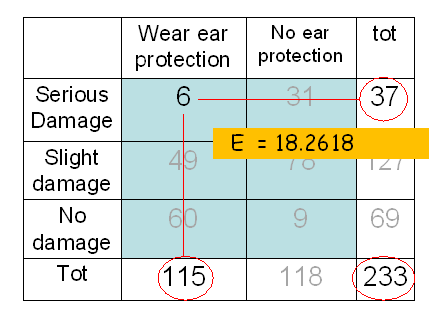
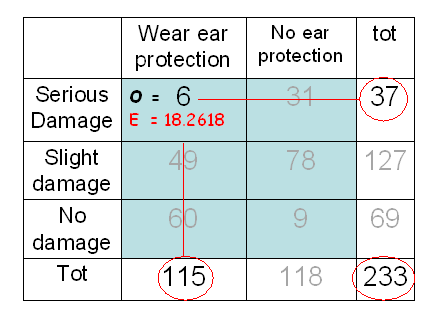
We can now add the EXPECTED NUMBERS for all cells:
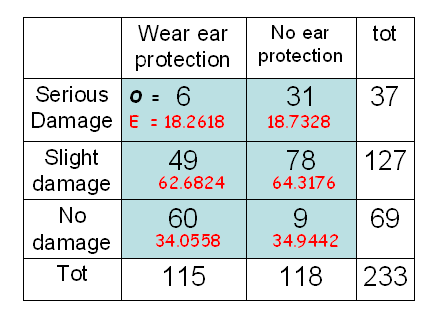
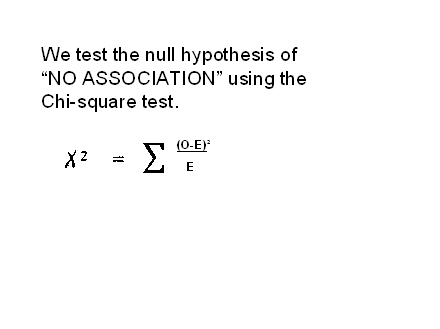
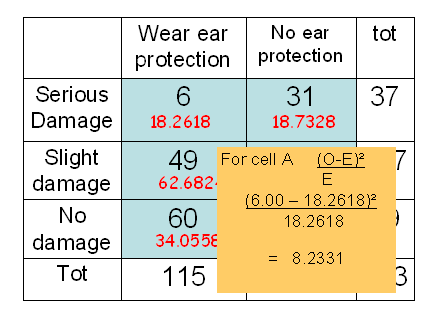
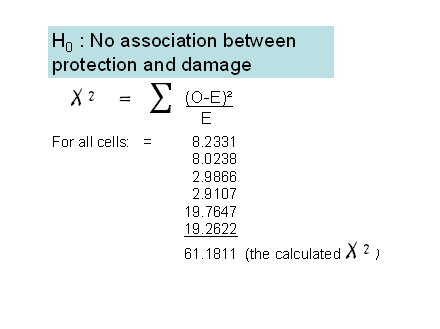
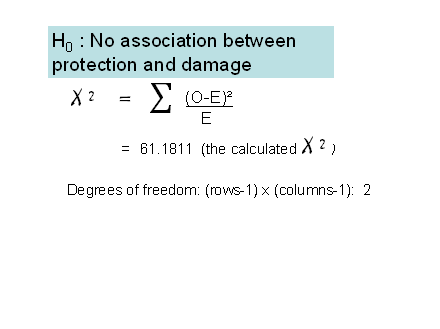
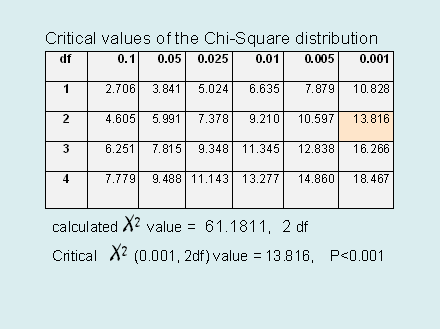
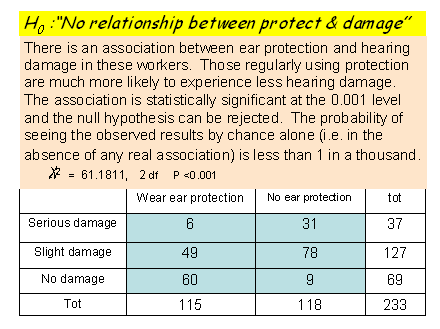
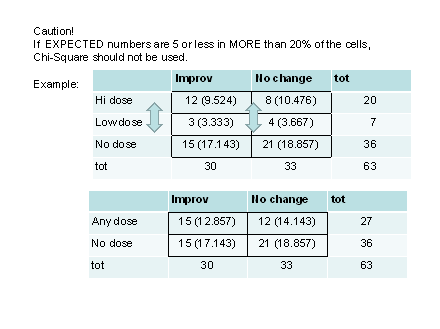
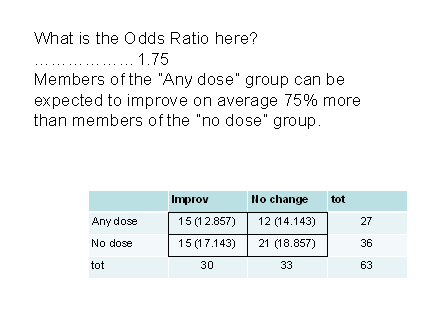
We can also ask:...
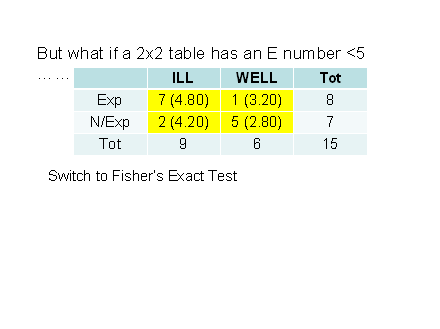
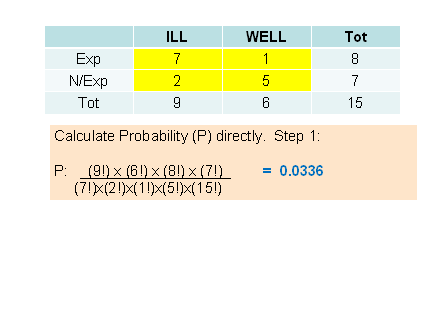
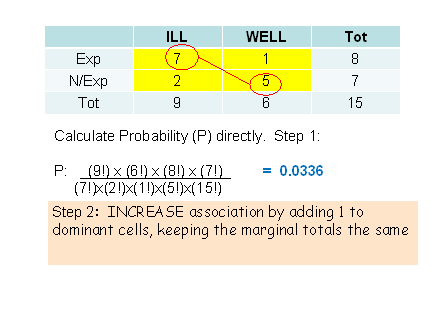
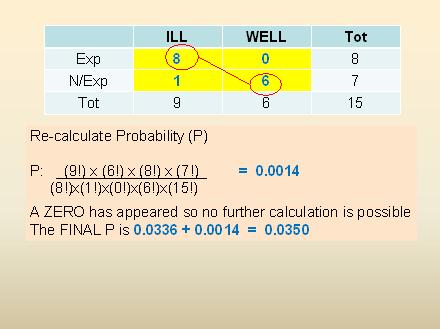
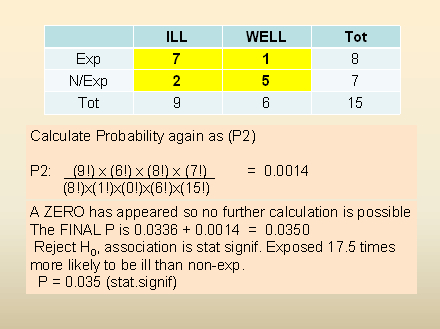
The interpretation of this analysis might run as follows: There was a relationship between exposure and illness, such that the exposed people were 17.5 times as likely to be ill as the non-exposed people. The probability of the original data appearing by chance along (i.e. under the assumption that the null hypothesis is correct) is exactly 0.035 or 3.5 percent. The null hypothesis can be rejected. P=0.035
So...... ALWAYS TRY CH-SQUARE FIRST. It is an EXCELLENT approximation for the Fisher's Exact Test. If the expected numbers 2x3 or 3x3 or 2x4 etc., are 5 or less in more than 20% of the cells Chi-Sq is not appropriate.
Action: Collapse rows or cells until E numbers are 5 or less in NOT MORE THAN 20% of the cells in the table.
If you get to a 2x2 table and EVEN ONE cell (25%) has an E number of 5 or less, then you must switch to the Fisher's Exact test.
Helpful hints with Fisher's Exact Test:
* Remember the numbers produced by the factorial (!) are astronomical!
* Cancel between numerator and denom where possible
* If numbers are large, alternate between Xnum and ÷denom to avoid an "error" meltdown in your calculator (>10^99)
* Interpret the final P value exactly the same as with any P value. For example P=0.0254 is between 0.05 and 0.01 . So it is statistically significant if you are accepting the rejection level of 0.05, but NOT if you insisted on P<0.01 as your rejection level.