ATTACK-RATE TABLES |
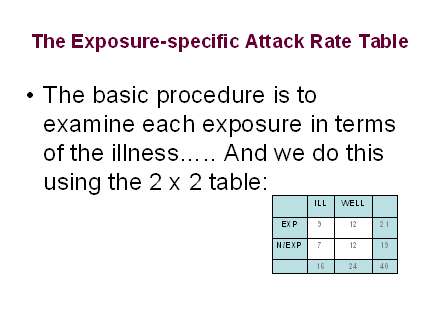
2x2 Tables (simple two-factor tables)
PLEASE ALSO TURN TO THE MORE
DETAILED SET OF GRAPHICS ON THE
ODDS RATIO AND TRUE RELATIVE RISK
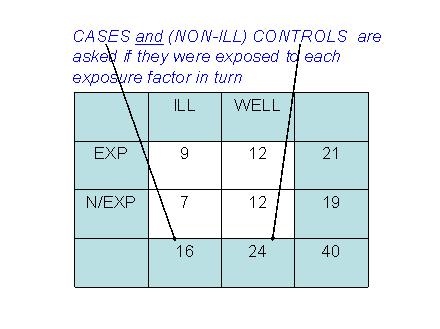
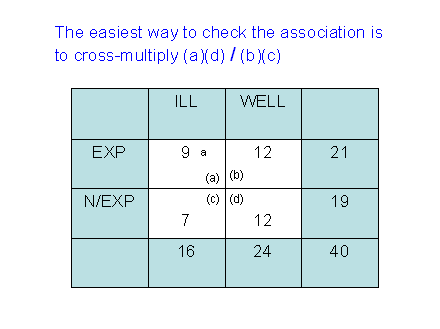
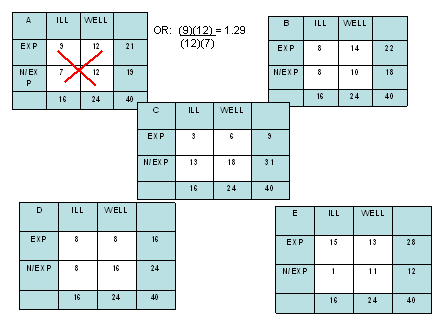
Exposure-Specific Attack Rate Tables
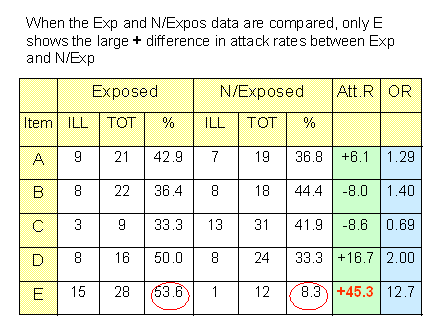
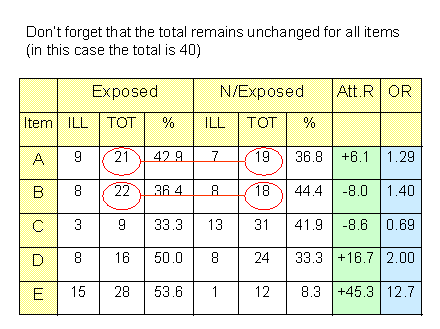
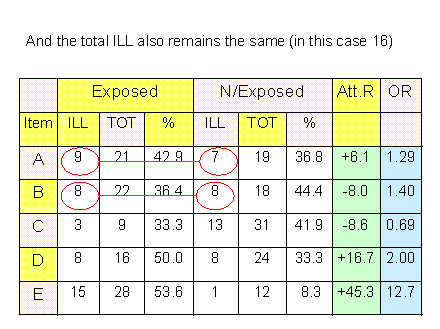
This table subtracts the incidence rate for non-exposed
people ( Io ) from the incidence rate for exposed people
( Ie ) and records that difference as the "attributable risk".
(Some tables just show this as the column headed "DIFF").
THE LARGEST POSITIVE DIFFERENCE will indicate the strongest
association between exposure and illness.
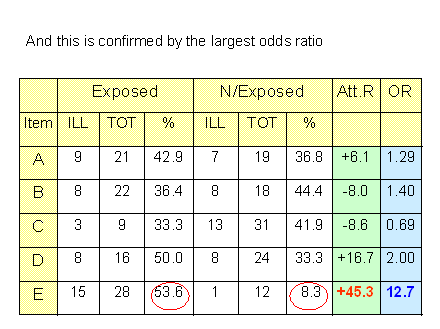
Another risk measurement is often used to give more infor-
mation - the ODDS RATIO. This indicates the strength of the
relationship between EXPOSURE and ILLNESS. Look at the
column O.R.: Food E has the HIGHEST ATTRIBUTABLE RISK
and also the highest ODDS RATIO.
The odds ratio tells us that people who ATE the food were
approximately 12.7 times more likely to have been ill com-
pared with those who did NOT eat the food E.
The attributable risk has less immediate value than the odds
ratio in these kinds of analyses. In fact there is a good
argument to be made to drop the Attributable risk completely
because it is calculated as the difference between incidence
rates (Ie - Io ), and as we had discussed, in most case-control
situations we never actually have the true incidence rate.
The following is a slightly more complex analysis to discover the
REALLY guilty exposure where there seem to be TWO strong
associations. I have left it here for your interest and use, although
there should not be any immediate application needed for the
assignment that you will be doing.

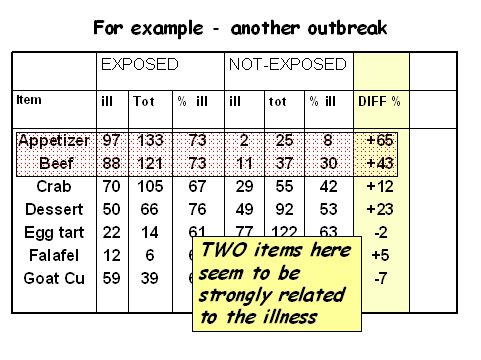
But in the table below, you can see these TWO suspect items have been
cross-matched against each other. In the margins, (to the right and below),
you can still see the INCREASE risk from eating each item. BUT look in
the centre FOUR cells and you can see something else:
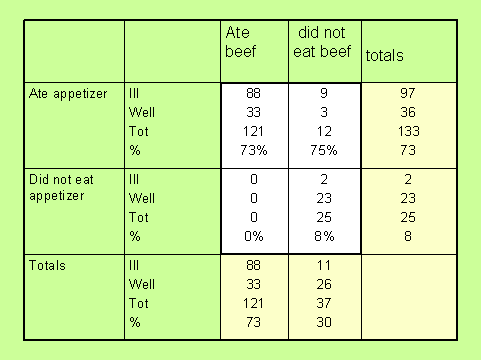
The percentages tell you that whether you ate the beef or not, eating the App
had a dramatic effect on your risk of illness! (You went from either
zero to 73% or 8% to 75% by eating the A ). You Cannot see any
such consistent increase in eating B food. (73%-75%, and 0% to 8%).
So even though they both looked suspicious to begin with, the A was
the real culprit!
This type of table is called a 'cross-tabulation', 'cross-table' or "cross-tab",
and the extra information in the four centre cells must come from the
original patient information forms, so DON'T throw those interview
forms away once you have completed the first food-specific attack rates chart!