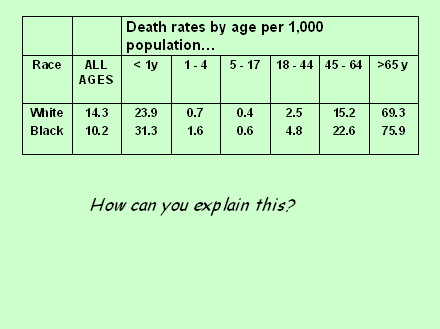
POWERPOINT PRESENTATION : RATES AND RATIOS (Please note that these are the visual images ONLY and do NOT include the discussion, questions, answers, and other aspects of the live lecture-session)

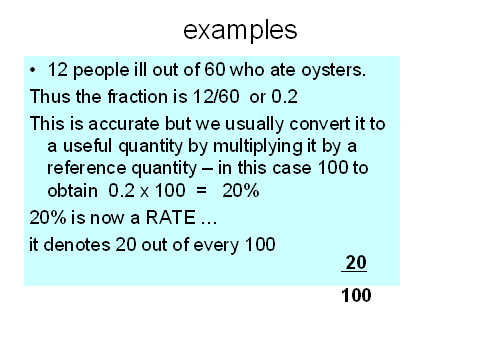
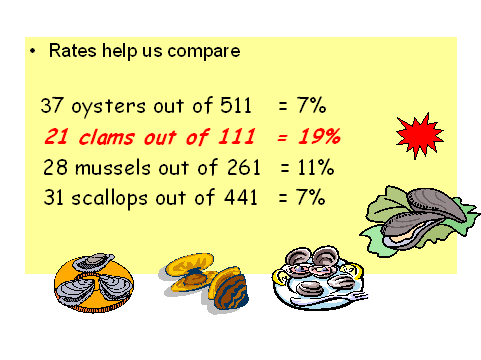
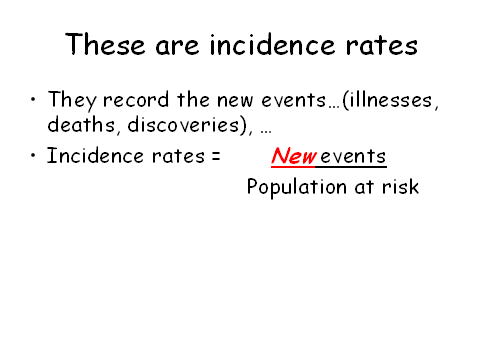
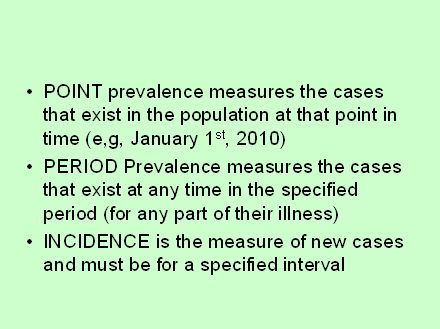


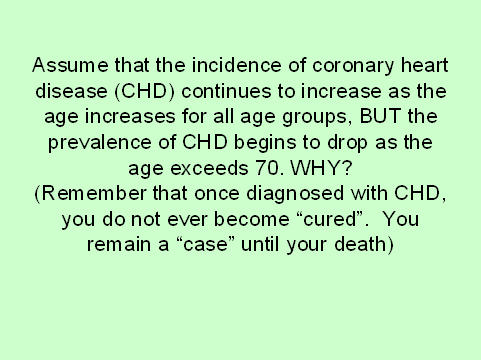


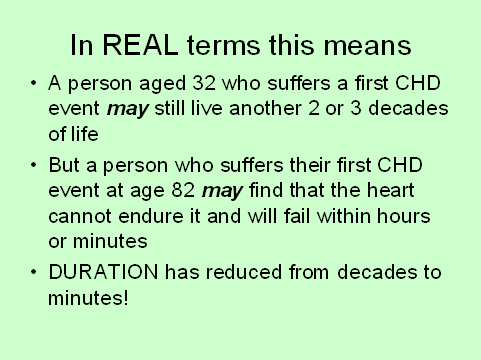
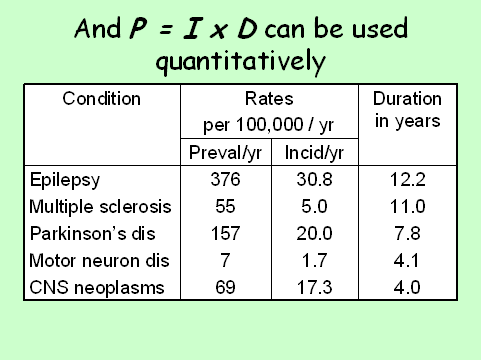
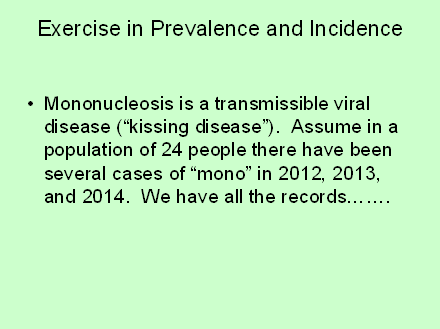
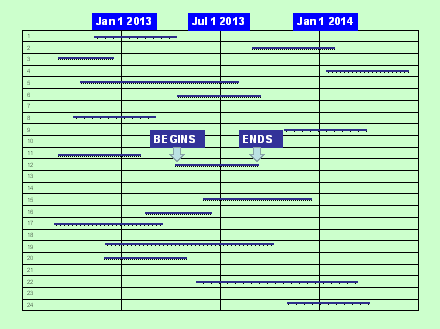
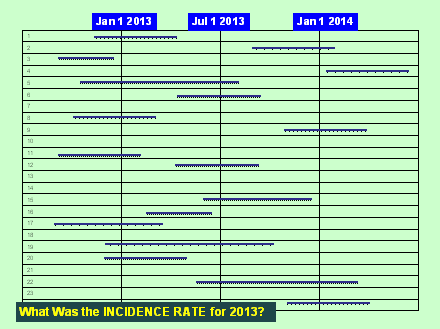
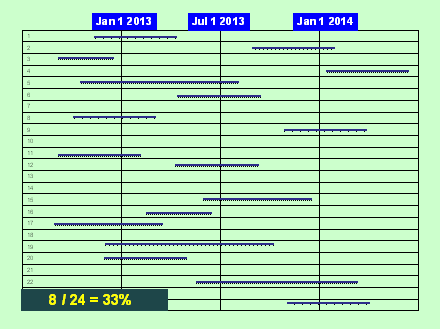
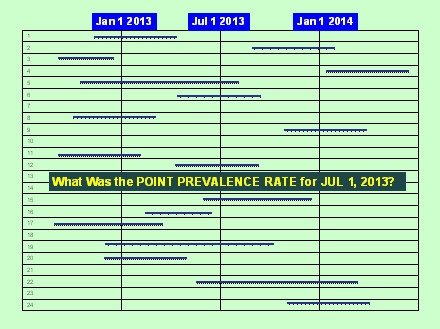
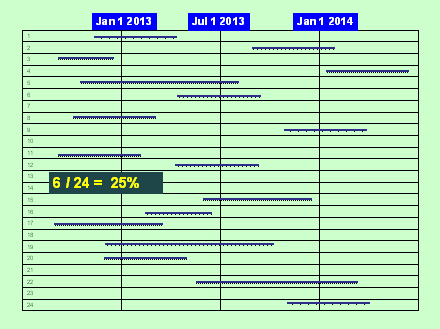
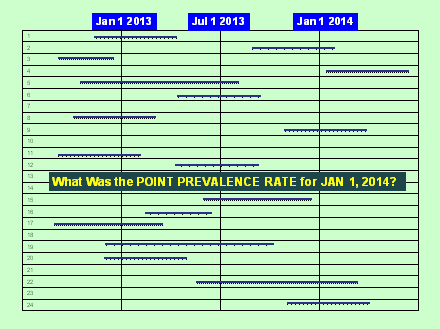
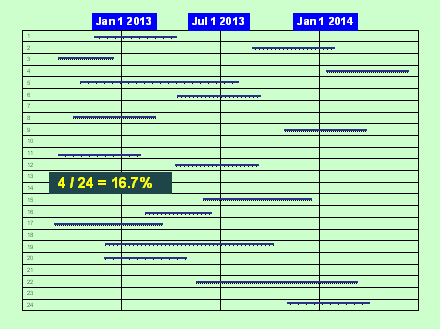
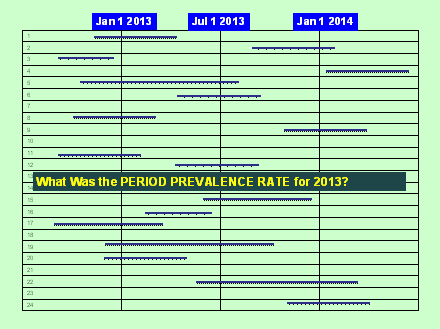
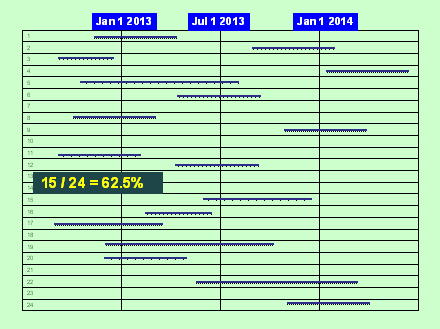
Each blue line represents a "case" (a person diagnosed with the
illness), with the duration indicated by the length of the line.
![]()
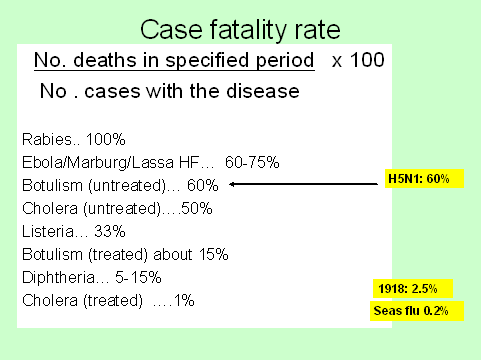
PLEASE SEE THE EXTRA DISCUSSION ON THE CORRECT CALCULATION
 OF
THE CFR
ON THE
MAIN PAGE
FOR ENH122
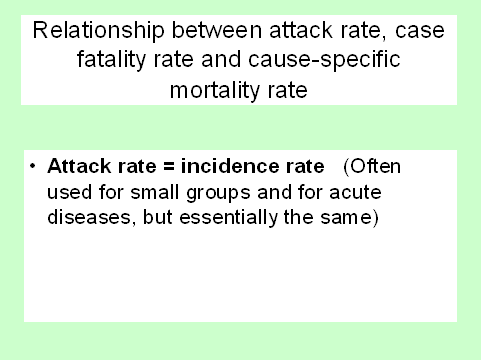
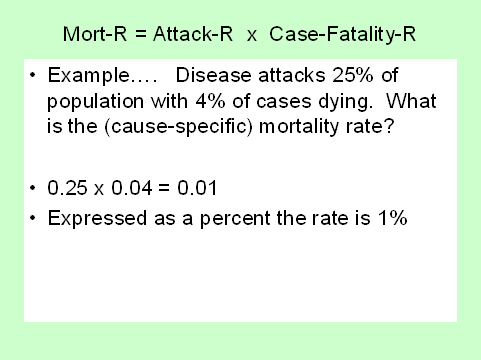
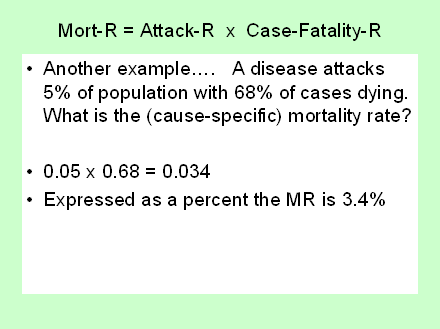
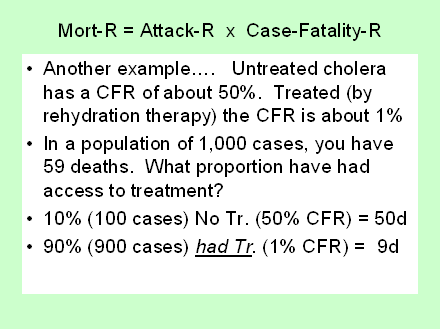
NOTE on the above......... IGNORE the "equation" (it is not relevant here)
Approach this by trying and repeating until you get close to the solution. You might
see what would happen with HALF treated and HALF untreated. THAT would produce
500 x 50% (=250 deaths), and 500 x 1% (=5d), totally 255d, clearly far too many deaths.
Now try 25% without treatment (125d) and 75% treated (7.5d)- still too high, and so on...
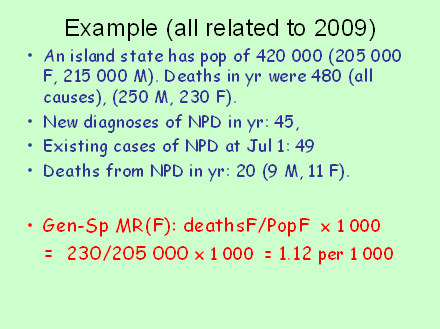
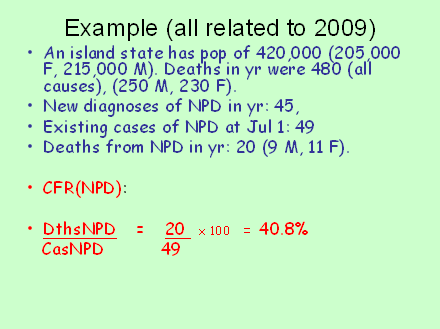
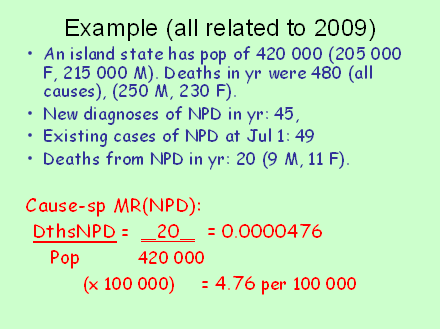
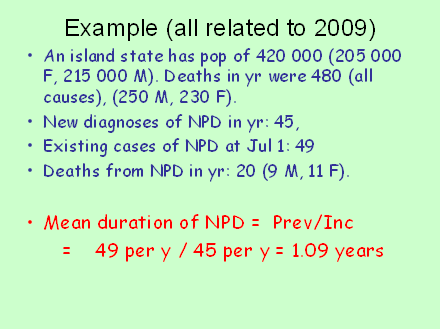
PLEASE SEE THE EXTRA DISCUSSION ON THE CORRECT CALCULATION
 OF
THE CFR
ON THE
MAIN PAGE
FOR ENH122
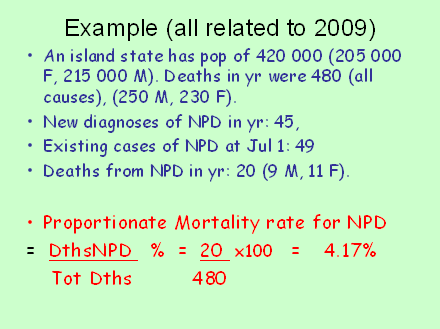
TEST QUIZ #1
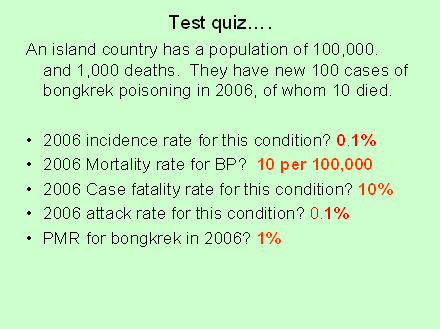
TEST QUIZ #2
| Spigott
County has a population of 530,000 in 2011. (275,600 male and
254,400 female. Deaths (all causes combined) in 2011 were 512 (266 m
and 246 f). New diagnoses of Osteohaemochromatosis (Os) in that year
numbered 42. The number of existing cases of Os on July 1st 2011 were
66. Deaths from Os in that year were 8 (5 m and 3 f). These
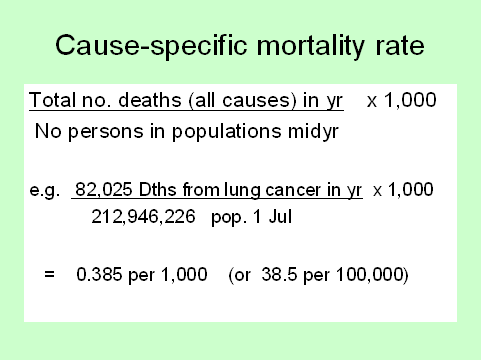
numbers are fairly constant from year to year. FIND: Crude mortality rate for Spigott County in 2011: ... 0.966 per 1,000 Gender-specific mortality rate (female) in 2011: ... 0.967 per 1,000 Cause-specific mortality rate for OS in 2011: .... 1.51 per 100,000 Case-fatality rate for Os in 2011 ... (This question should really give the total deaths and the total cases - especially if the outbreak extends longer than the usual annual reporting period. If the outbreak is complete in less than the reporting year, then it's total deaths in that year over the total cases in that year (incidence). This example would not now be asked in a mid-term because it's incomplete.
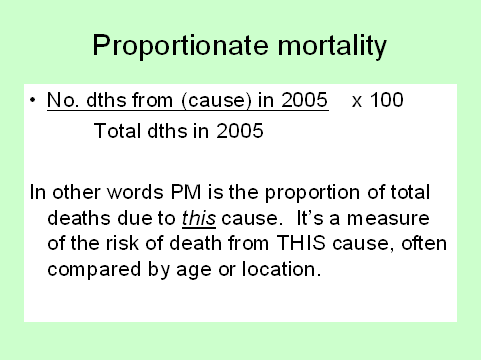
Mean duration of Os:................. 1.57 years Proportionate mortality rate for Os in 2011: ...... 1.56%
|
TEST QUIZ #3
For the answers, drag the cursor over the space
beside the question, BUT TRY IT YOURSELF FIRST!)
|
Ailsa Braig has a
population of 102,500 in 2010. They eat a lot of rice but the climate
is wet. Every year they have cases of Bongkrek poisoning (Bp) due to
eating mouldy rice. In 2010, 1005 people died (all causes
combined). 110 new cases of Bp were diagnosed that year, 12 deaths were
recorded in the year due to Bp.
FIND 2010 incidence rate for Bongkrek poisoning: 1.073 per 1,000 2010 cause-specific mortality rate for this condition: 1.171 per 10,000 2010 case-fatality rate for this condition: 10.9 % 2010 PMR for this condition: 1.194 % (In this question, the outbreak is short each year (a point source). Therefore, the CFR is easily calculated as the total deaths for Bp (12) over the total cases 110, giving 10.9% Where the outbreak is longer or even ENDEMIC you need to be given the TOTAL deaths for those TOTAL cases. Any question you are given would clearly allow you to calculate the CFR properly
|
