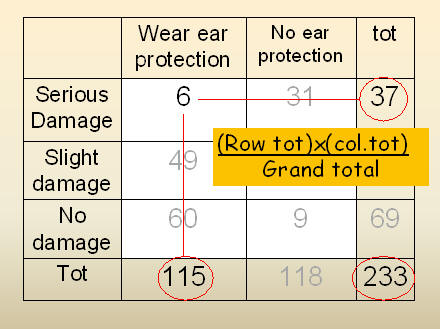
Clearly, for those with serious damage, MOST (about FIVE TIMES more) people wear NO hearing protection, whereas for those with NO hearing damage, MOST (more than FIVE TIMES more) people wear hearing protection! So there DOES seem to be a relationship!
Could this "relationship" have occurred just by chance (assuming there was NO benefit from wearing hearing protection)?
To do this we test the Null Hypothesis of "NO RELATIONSHIP" between wearing protection, and hearing damage...
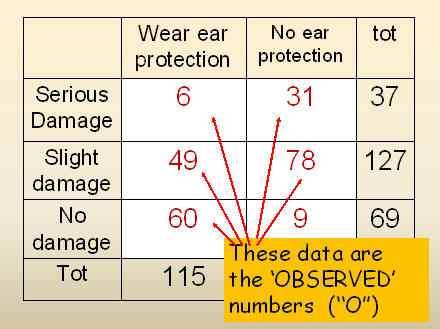
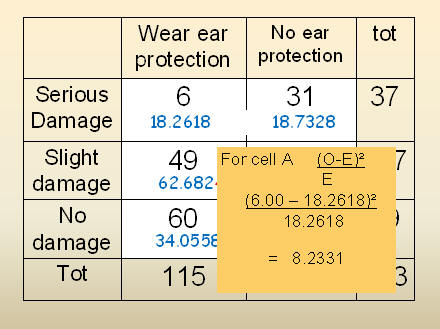
We now need to compare these numbers with the numbers we would expect if there was NO relationship between protection and damage, the "EXPECTED" numbers... Here's how we get the EXPECTED [E] numbers:
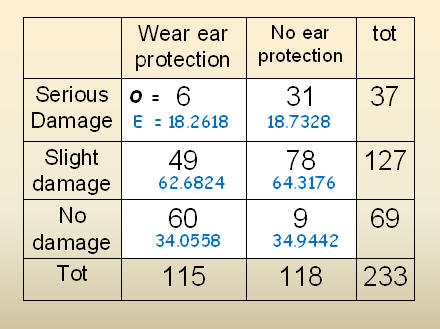
Degrees of freedom are [ROWS-1]x[COLUMNS-1] or here 2x1=2
...One way is to collapse either rows or columns
But if a table already has only 2x2 cells, even ONE cell is 25% so NO cell of a 2x2 table can have an [E] number <5
.
Fisher's Exact Test calculated P directly as
P = (A+C)! x (B+D)! x (A+B)! x (C+D)!
A! x B! x C! x D! x (A+B+C+D)!
A B A+B
C D C+D
(A+C) (B+D) (A+B+C+D)