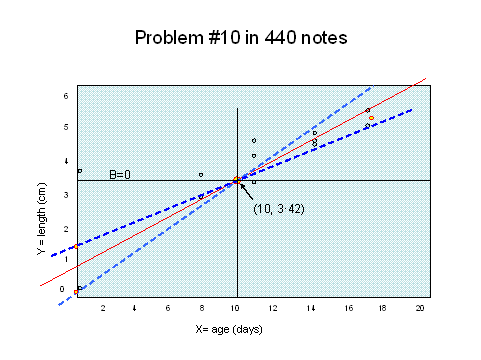
Here is the graphic view of #10

Note that you can choose ANY point on the x axis for
the "pivot" point. I have chosen x=10.
When x=10 is entered into the Y' = A + BX equation,
I obtain Y' = 3.42
CL around B are calculated as CL(99.9
%) =
B ± t(0.001)(11df) x (SB)
Thus CL(99.9 %) = + 0.270 ±
(4.44)(0.0135)
giving the two limits: + 0.32994 and +
0.2116
BOTH are the same sign (+) as the original slope so we
can reject the null hypothesis at 0.001
To draw the lines on the scatter plot we need the new A
values for each CL slope.
A = Y - BX
A = 3.42 - (0.32994)(10) =
0.1206
A = 3.42 - (0.21006)(10) =
1.3194
These are indicated on the Y axis and the line drawn